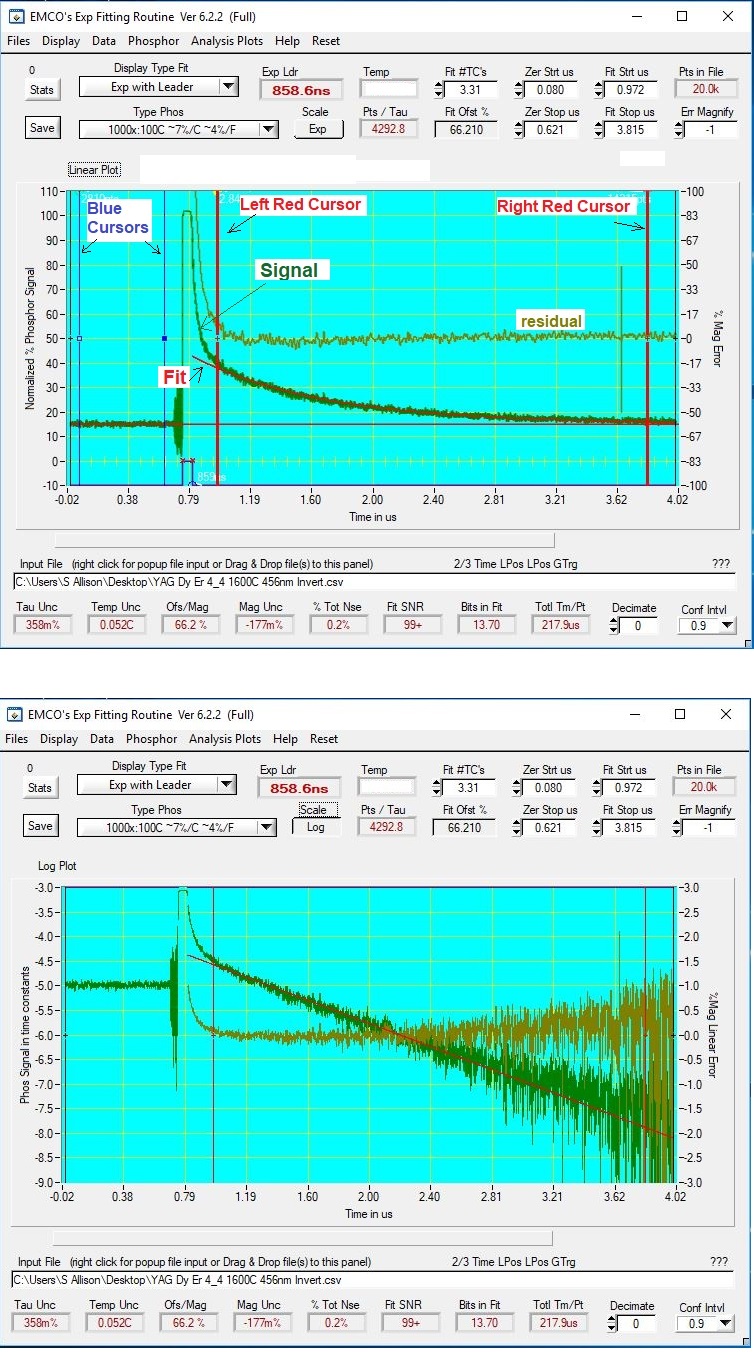
EMCO’s Exponential Analysis Program
This program is a data analysis program for exponential curves generated by phosphor signals which are inherently noisy and usually have offsets which may or may not be known.
Key aspects of this program:
Fits least-squares exponential curves with offsets directly to the data or to the logarithm of the data.
User friendly display allows regions of fit to be set by dragging a cursor with continuous update of results or by numerical input.
Ability to accept trigger information or LED excitation amplitude for deconvolution of phosphor signal.
Designed to identify and process phosphor signals generated by a laser spike or LED cycles.
Under user direction more than one time constant present can be identified and extracted.
Option to coalesce multiple LED cycles into one cycle for effective averaging.
Can average multiple files into one average.
Can process multiple files separately with a common setup.
Ability to read many different types of input files with a table definition file and also intelligent sorting of generic file inputs.
Option to log results automatically as user processes data.
Direct connection to multiple types of oscilloscopes and data loggers.
User can generate dummy data for practice and verification.
Intelligent initial cursor setting.
Adjustable display plots with fit and error types to both linear and log plots.
Multiple fit types with best offset, user input offset, and data region offset.
Internal data backup to recover after user adjustments to original data.
Ability to decimate, truncate, and/or scroll data to create more useable sized files.
Data is automatically segmented into regions of uniform (stable states) for individual processing.
Statistical error analysis for confidence intervals on results.
Simple phosphor table input (user updateable) for conversion of time constants to temperatures.
Help feature on every display item with a simple right-click of the cursor.
Displays full information about a fit: Time Constant, Magnitude at start of fit, Offset used,
Temperature (if phosphor line selected), Uncertainty on time constant / temperature, Noise levels (shot, electronic, total, etc.), Effective data bits, and statistics with uncertainties on all of these.
Panels for full scope/digitizer input control with auto setup for sample rate, time axis, data capture length, channel gains, and ID of channel(s).
Data can be saved by user command or automatically in either a full or abbreviated format for recall or use in other programs such as Excel.